Product decisions rarely fail because teams care too little. They fail because the signal is buried.
Most organisations already have sales data, usage data, pricing history, support tickets, stock records, campaign results, and a long trail of decisions made under pressure. The hard part is turning that into something useful at the moment a team must choose: which products to keep, which features to prioritise, how much demand to expect, where to promote, and when to stop investing.
That is where machine learning earns its keep. Used well, it moves teams from broad averages to decision support that is specific enough to act on: better portfolio choices, tighter forecasts, and promotions based on likely response instead of habit.
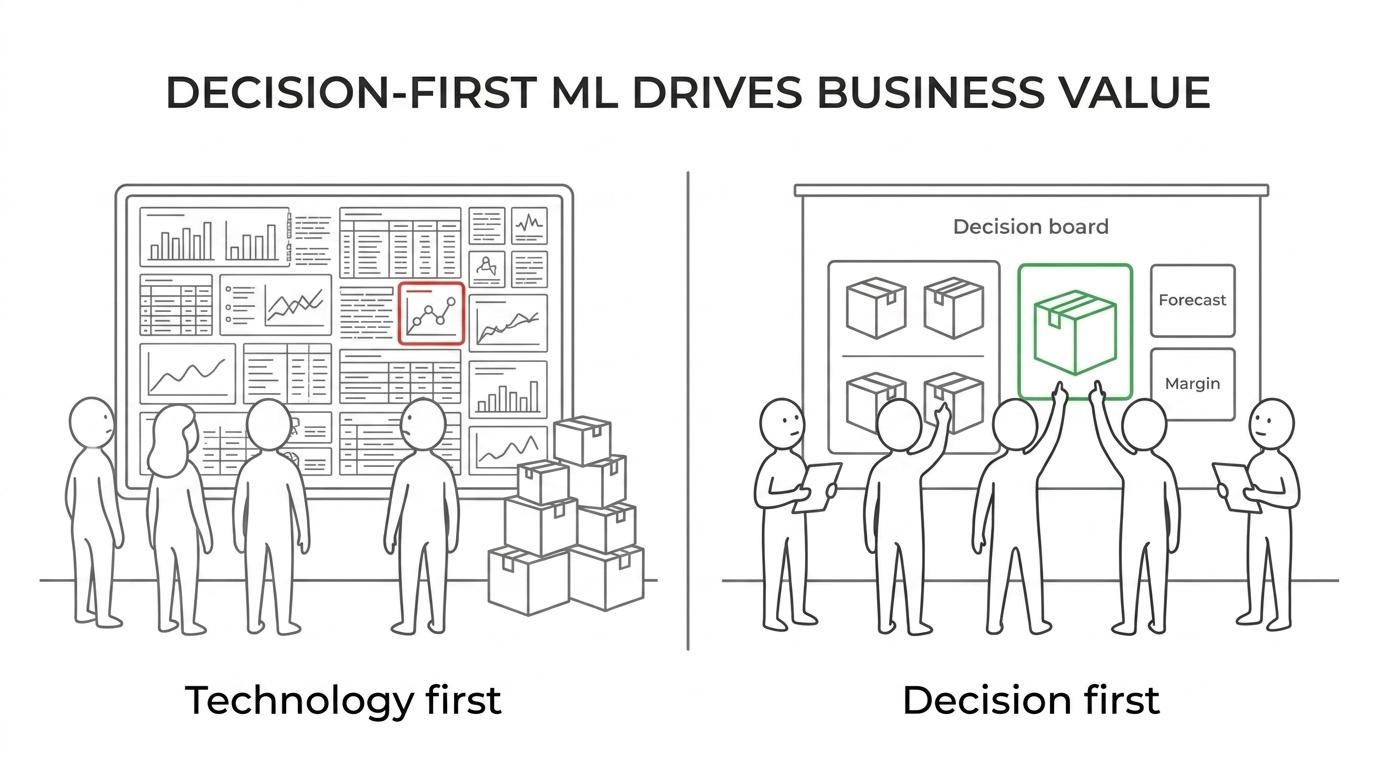
Start with the decision. Build the analytics around it. Not the other way around.
Use cases beat prototypes
A technology-first approach often produces impressive demos and little business movement. A use-case-led approach begins with a decision that matters, a measurable outcome, and enough operational data to support a better answer.
Attach the work to concrete questions: which SKUs are underperforming, where pricing is inconsistent, which promotions lift visits without eroding margin.
Machine learning is not the strategy. It is part of the operating system behind stronger choices.
Product decisions are rarely one-dimensional. A portfolio review is not only about revenue. Forecasting is not only about volume. Promotion planning is not only about conversion. Each one trades off cost, availability, demand, timing, and risk. Scope the model around those trade-offs and it becomes easier to justify and measure.
Common starting points:
- Product portfolio rationalisation
- Demand forecasting by SKU or segment
- Promotion targeting
- Pricing inconsistency detection
- Customer response prediction
- Component or feature similarity analysis
Data quality is the real constraint
Models work when product, customer, or demand data is detailed enough to show patterns you cannot see in a monthly total.
Useful inputs often include attributes, demand by location, lifecycle stage, price changes, supplier variation, campaign timing, returns, support trends, and external events that affect buying. Granularity changes the answer: a model on total sales may say demand is falling; a richer view may show one segment leaving, one geography growing, one variant cannibalising another, and one promotion type creating spikes without repeat behaviour. Those situations need different decisions.
Connected data matters as much as volume. If commercial, operational, and product signals stay in separate systems, decision support stays shallow.
| Decision area | Useful inputs | Typical output | Business benefit |
|---|---|---|---|
| Portfolio optimisation | SKU attributes, margin, sales history, returns, supplier costs | Clusters, overlap, underperforming combinations | Cleaner mix, fewer weak products |
| Demand forecasting | History, seasonality, lifecycle, promotions, market events | Forecast by SKU, channel, region, period | Less waste, tighter inventory |
| Promotion targeting | Customer history, visit frequency, basket data, response | Propensity scores, offer ranking | Better spend efficiency |
| Pricing analysis | Specs, competitor data, transactions | Price gaps and anomalies | Faster correction |
| Product planning | Usage, support, churn, feature adoption | Demand and risk signals | Clearer prioritisation |
Portfolio optimisation
Too many products, too much overlap, and too little clarity on contribution is a familiar problem. Clustering on attributes, behaviour, cost, or commercial outcomes can surface duplicates, inconsistent pricing, and complexity that no longer pays for itself - across physical catalogues or digital tiers, bundles, and segments.
The model does not make the keep-or-kill call. Teams still need criteria:
- Commercial value: revenue, margin, growth
- Strategic fit: position, capability, direction
- Operational cost: support burden, supply complexity, delivery risk
- Customer impact: adoption, retention, usage depth
- Decision rules: agreed criteria that reduce politics
Without that layer, patterns appear and nothing changes.
Forecasting
Traditional forecasts often lean on a narrow set of inputs and heavy manual adjustment. That holds in stable environments and breaks when ranges expand or external factors distort history.
Machine learning can use lifecycle signals, promotional history, customer behaviour, regional variation, and external events to produce granular views by SKU, segment, location, or channel. The operational win is not a prettier spreadsheet. It is less excess stock, less obsolescence, and less padding because nobody trusts the number.
Useful forecasting work usually includes three linked outputs:
- Baseline demand prediction
- Explainability on the main drivers of change
- A review workflow for override and accountability
Forecasts touch production, purchasing, staffing, and cash. Teams need a model they can challenge.
Promotion targeting
Broad segments and historical averages leave money on the table. Some customers would have bought anyway. Others need a different offer. Some promotions raise activity without helping margin or retention.
Response models at the customer or segment level let budget move toward combinations more likely to work. Live testing methods, such as multi-armed bandits, can shift traffic toward stronger offers during a campaign instead of waiting for a long post-mortem.
A practical workflow covers:
- Target selection: who should get an offer and why
- Offer choice: product, incentive, or message
- Channel and timing: when and where it is likely to perform
- Live adaptation: move spend toward what works
- Guardrails: margin floors, stock limits, brand rules
This does not replace marketers or product managers. It gives them a sharper instrument.
Governance is not optional
Good models increase the need for governance. A model can surface likely outcomes; it cannot decide what the business values most, or settle short-term revenue against long-term positioning.
Define model review, data quality checks, override rules, and who owns outcomes. If forecasts improve but inventory policy does not change, the value stays theoretical. If promotion scores exist but campaign systems cannot use them, the model is a report, not a system.
Healthy programmes usually show:
- A clear business owner
- Agreed success metrics
- Written decision rights
- Operational systems connected to outputs
- Regular review of drift, bias, and exceptions
Durability rarely fails on accuracy alone. It fails when there is no repeatable path from signal to action.
How to start without a “transformation”
Pick one or two high-value decisions, review the data you actually have, and state what will improve if the work succeeds. Then build the pipelines, modelling approach, review process, and integration points needed to put outputs into live operations.
The shape of the work is straightforward:
- Discovery: decision, constraints, data, commercial target
- Data foundation: reliable pipelines and shared definitions
- Model development: build and compare against the decision goal
- Operational rollout: dashboards, workflows, or product systems
- Iteration: review results, retrain where needed, widen carefully
Better portfolio choices, lower forecast error, and more precise promotions do not come from more fashionable technology. They come from decision support built around the moments that shape product performance.
When you are ready to evaluate delivery partners, use how to hire an AI development company. If the surrounding platform also needs to change, see custom software development.
If you are scoping machine learning against a real product decision, book an assessment to talk through use cases, data readiness, and a delivery path you can own.